ARVO Day 4: Miles to go before we sleep
May 14, 2012
by Jennifer Phillips, Ph.D.
The bulk of the presentations I took in today were reports from clinicians treating Usher patients. I don’t get to interact with clinicians on a regular basis, so it is hugely instructive for me to get their perspective on diagnosis and monitoring of the progressive retinal degeneration seen in Usher syndrome. I’m keenly interested hearing about what they do and how they do it, because in some ways it seems like we’re looking at the same biological phenomenon through opposite ends of a telescope. I see the tissues, the cells, the proteins underlying the disorder. They see the whole person with the disorder.
It’s a perspective I value deeply, as it underscores the importance of building bridges toward one another: compressing the telescope so that our parallel efforts can be combined to help the people we are, through our different approaches, wholly focused on.
I spoke with clinicians who see Usher patients in five different countries. I asked them lots of naïve questions from my basic research-oriented perspective and had some extremely interesting conversations, some of which I’ll discuss below.
All the clinicians I spoke with were presenting different combinations of patients with certain USH subtypes or mutations, they are all using essentially the same tools to detect and follow the vision loss in Ush patients. As such, all are facing very similar limitations and frustrations. The common theme I heard was: it is quite hard to find any kind pattern in the variable clinical presentations of Usher syndrome, or even, to some extent, in the genes that cause Usher.
Clinical researchers from the Children’s Hospital Boston presented clinical test data from 18 young patients, aged 2 months to 17 years, with Usher syndrome: 12 with some sort of Ush type 1, 5 with Ush2a, and one Ush3a. One of their advantages was that they had long-term data on many of these subjects, an accumulation of years’ worth of test results to try to follow the disease progression. These clinicians reported a variety of retinal function tests, showing that most of the 18 patients had stable retinal function, although most or all were below the normal range, depending on the particular test. This makes sense given their ages, as severe drop-off in retinal function is most often seen later in life. Even within this small group, however, the representative Ush2a patient and one of the Ush1b patients showed precipitous declines in visual function over the time they were followed—showing that even in this age group there is variation in disease progression. One of the more positive findings presented was that visual acuity within the central retina—the part that usually lasts the longest in Usher patients, as degeneration most often proceeds from the peripheral retina inward—was within “normal limits” in the majority of these 18 patients. On the low end of “normal”, but still reassuring. The take home message from this group was that early defects can be detected in young Ush patients with these retinal tests, and as such, early assessment of retinal function in children with hearing problems is critical. I asked the presenter how she envisioned such early diagnosis becoming a standard of care and she replied that they were working with the Otolaryngology Department at their hospital to develop a comprehensive way to communicate the need for this screening to the local practitioners.
Another poster presented data accumulated from Usher type 1b patients at several London hospitals and one in Slovenia. The idea behind this particular research was to focus on the various mutations found in the MYO7A gene in these Ush1b patients and see if they could find a correlation between the particular location of the mutation (that would affect a particular domain of the encoded protein) and the severity of the disease phenotype. The median age of the participants in the study was 34 years, with data collected from 29 patients between ages 3 to 65. The median age of symptom onset was 9 years, and this too ranged from age 5 to 35. A few patients in the study were young enough not to have complained of vision loss yet. As with the previous report from the Boston study, the best news was that 50% of these Ush1b patients retained good visual acuity, albeit with the predictable visual field limitations, up to 40 years of age. Even with just looking at this one Usher type, however, huge variations were observed in the rate of decline and the severity of the vision loss. Moreover, no correlation was found between the location of the mutation and the specific vision loss symptoms. This should give you some idea of the incredible complexity we—and by ‘we’ I mean both the clinicians and the basic researchers—are dealing with in studying this genetic disease. The progression is predictable to a point, but with very large margins of error. It’s frustrating for me to have to think around these problems in a lab, knowing that I can’t predict what will happen when I disrupt a particular part of the coding region of a gene. It must be incalculably more frustrating for a clinician not to be able to say with any confidence what a young patient might expect. Of course they can explain that most patients with the same disease type experience certain things, but can’t deny that every case has the potential to be unique.
Other clinical results I saw presented dealt with genotyping: analyzing the genes of patients with clinical diagnoses of Usher along with those of living family members to try and identify the causative mutations. Some of these presentations dealt with comparing the different methods of sequencing available, and the bottom line on these is that the most accurate method is very slow and expensive, but there are faster, more cost-effective methods that can be used to generate a ‘first look’ at a family’s genetic variation. Other genotyping presentations revealed, yet again, the profoundly complex variation seen in Usher syndrome and, specifically, the difficulty in correlating the clinical symptoms with a particular genetic problem. One such study looked at a small subset of Ush patients in whom the causative genes were not known, and reveled the difficulties in figuring out which DNA changes in any given gene might be pathogenic, i.e. result in disease symptoms. Our genomes are full of differences—if you compared even a small genetic region, let’s say the sequence of a gene known to cause Usher syndrome when mutated, between two healthy people you would find an abundance of differences in the specific code. If you compared that same region between an Usher patient and a healthy person, you would find differences as well. The question is, which one of those differences, if any, is causing the Usher syndrome? Genetic comparisons between family members usually show fewer differences than comparisons of two unrelated humans, but there’s still a lot of variation to comb through, and while new sequencing techniques and software designed to read high volumes of DNA code and predict differences that could be pathogenic are widely available, it’s still a really tough and often inconclusive problem.
Another presentation by clinicians from Denmark really highlighted the need for better gene identification techniques. In their study, they looked at children aged 0-17 years with clinically diagnosed retinal dystrophies, including Usher syndrome, to establish the prevalence of this type of disease in Denmark and get a handle on how well the specific genetic cause could be identified. Their findings revealed that the prevalence of retinal dystrophies in this age group was 13 per 100,000 children, and, again most frustratingly, in more than half of these cases the causative gene was not identified. This is lamentable indeed, because while other research presented at this meeting makes it clear that we are really close to some sight-saving gene therapies, having access to these therapies, even in clinical trials, requires that the gene causing the vision loss is known.
___________________________________
The last set of presentations I visited described a widespread technique for analyzing progressive RP, where retinal images are taken under specific, restricted wavelengths of light, similar to those wavelengths used in fluorescent imaging. In many RP patients, this lighting reveals a ring-like pattern in the retina that fluoresces in the absence of any dyes or other chemical fluorescent markers. The source of this so called “auto-fluorescence”, or AF, is the accumulation of various shiny pigments in the retina, a hallmark of photoreceptor dysfunction that often precedes cell degeneration. One clinically interesting thing about these AF rings is that they often appear before other visible changes to the retinal architecture. The cells can still look ‘normal’ by other tests, but the presence of AF in these regions indicate that cell function is abnormal.
In Usher patients as well as those with other types of RP, this AF ring constricts over time, slowly closing in on the central retina. The cells within the ring are normally the cells still functioning well. Cells on the outside of the ring are often the ones already degenerated or severely impaired. The cells constituting the ring itself are on the border between the two. It’s a simple yet powerful way to take a look inside of an eye and assess how things are working, and, as many clinicians shared with me, one of the clearest visual ways to explain to a patient and his or her family how the disease is progressing. Below are some images that should help explain the diagnostic potential of this type of test:
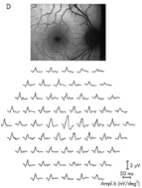
Figure 1: image taken from Robson et al., Br J Ophthalmol 2006;90:472-479
Figure 1 shows a normal or ‘control’ eye from a healthy patient. The top panel is the picture taken with fluorescent lighting to show how the retina looks with no specific regions of AF, although the peripheral areas of the retina seem a little ‘glowier’ than the central region. The dark patch off to the right there is the optic nerve, by the way. The bottom panel is a representation of what’s called a multifocal electroretinogram, or ERG. In a standard ERG, electrical responses from all the retinal cells are combined into a single oscillating line or ‘trace’ that looks something like this:
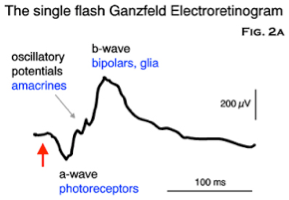
Figure 2: image taken from http://www.thebalticeye.com/ZURICH.html
You can tell a lot about what the different cell populations in the retina (note the different peaks and valleys on the trace are labeled with the names of different cell types and functions) are doing, collectively, with this analysis, but you can’t assess whether all the cells in these various populations are performing at the same rate. In the multifocal ERG shown in the bottom panel of Figure 1, the cell responses from all the different regions of the eye aren’t pooled. So what you see is a series of little traces that in this control eye have essentially the same shape as each other and the same basic shape as the standard ‘pooled’ ERG shown in Figure 2. Another thing you can note is that the traces in the central region of the eye appear taller. This is due to the higher density of photoreceptors—mostly cones—in that region of the retina. There are simply more cells present there to give electrical responses, so the peaks appear larger. Lastly, the traces in the middle region of the far right of this mfERG are a bit flat. Note that this corresponds to the region of the optic nerve, often called the ‘blind spot’, where there’s a bit of a gap in the retinal cells for all those nerve fibers to pass through. Thus, it makes total sense that you’d get a diminished response from this particular region of the retina.
A standard ERG from an RP patient, depending on how advanced the degeneration is, is markedly abnormal. The peaks and valleys sort of flatten out, indicating that the overall response from the eye is reduced. But as we know, Usher syndrome doesn’t affect all areas of the eye equally, so maybe looking at one trace representing the entire retina isn’t telling the whole story. Enter the multifocal ERG. You’ve seen in figure 1 how it looks in a healthy eye. Let’s take a look at an eye with progressive retinal degeneration, as indicated by that AF ring we discussed earlier, and compare it to the control I showed in Figure 1 above:
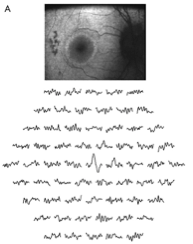
Figure 3, from Robson et al.
The first thing to note is the AF ring, which appears white in the top panel image. The second thing to note is the differences in the sizes (what we call ‘amplitude’ in the trade) of the traces in the lower panel compared to the control. Again, these traces represent different, local responses from various regions of the retina. As with the control up in figure 1, you can see that the traces in the middle of the field, representing the central retina, are taller than the ones in the periphery, but unlike the traces in figure 1, they are not all the same shape. The traces in the periphery are much flatter and less organized squiggles compared to the smaller yet still well formed traces in the comparable regions of the control eye. Notice how the shape of the traces seems to degrade the farther out from the center they are.
The third and final thing to notice is that the part of the retina producing traces of more normal looking size and shape is pretty much aligned with the region that lies inside the AF ring. Without knowing how many cells actually remain alive in those peripheral regions, we can tell from the combination of these two analyses that cells at or outside of the limits of that bright autofluorescent ring are having problems. And, because this is correlation between AF ring position and retinal cell function is quite well established, a clinician can show a patient a picture of the AF ring in his or her retina and it will be fairly representative of where the remaining vision is. It certainly seems much easier to look at than those squiggly electrical output images!
____________________________
So, the good news is that there are clearly some very fine-tuned clinical tools in use worldwide that can diagnose and track retinal diseases and syndromes like Usher. The more challenging news is that all we can currently do is track it, rather than fix it, or even slow it down. And even though some patients might be helped in the near future by the emerging gene and cell therapies, there is a tremendous amount of work left to do before such therapies are available to all, or even most, of the sufferers of these diseases. We have far to go before these projects are completed. Miles to go before we sleep, to paraphrase Robert Frost.
Although the ARVO meeting will continue for a 5th day, this will be my last installment of the meeting updates this year. Because I came to Florida two days early for the Ciliopathy meeting, I’m skipping out early to make the long trek back home, so I have miles to go before I sleep literally as well as metaphorically.
I’m returning home inspired and a little overwhelmed as usual. Impressed with the wealth of quality data and quality people who are working so hard to improve vision in the world, a little frustrated at the limitations we all face, but motivated to continue pursuing my research and adding pieces to the puzzle. And of course I’ll be back this time next year, reporting on ARVO 2013.
I hope these posts have been informative, and as always I welcome any questions or comments from our readers